
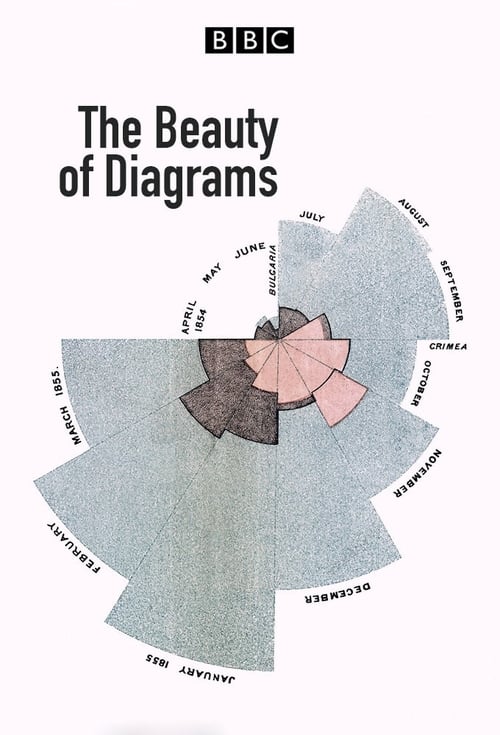
The Rose Diagram, Florence Nightingale
Free on SceneLog — log in or create an account to track it.
Overview
A look at Florence Nightingale's use of statistical graphics as a call to action following her experience of caring for soldiers during the Crimean War of 1854-1856. She compiled her findings into a report featuring the Rose Diagram, which explained how 16,000 of the conflict's 18,000 deaths were a result of infectious diseases found in hospitals, and was used to persuade the British government to improve sanitation.

Comments
Be the first to comment.
Leave a comment
Your email won't be published. Comments are reviewed before they appear.